Choosing the Best Correlation Test !!!!!
논문을 보다 보면 정말 다양한 통계 기법이 쏟아지는데,
그중에서도 상관분석은 자주 등장하면서도 가장 혼란을 주는 분석 중 하나입니다.
처음엔 cor.test()만 믿고 분석했다가,
**"데이터 특성에 맞는 상관계수를 쓰지 않았다"**는 이유로 분석을 다시 시작한 경험, 있으시죠?
이 글에서는 언제 Pearson을 쓰고, 언제 Spearman이나 Kendall을 써야 하는지
명확하게 구분해서 설명드립니다.
1️⃣ 상관분석이란? (What is Correlation Analysis?)
상관분석은 두 변수 간의 관계의 강도와 방향을 측정하는 통계 기법입니다.
(a statistical method used to assess the strength and direction of the relationship between two variables)
- 📈 Positive Correlation: 한 변수가 증가할수록 다른 변수도 증가
- 📉 Negative Correlation: 한 변수가 증가할수록 다른 변수는 감소
- 0: 아무런 선형 관계가 없음
💡 주의!
상관관계는 인과관계가 아닙니다
(Important to note that the presence of a linear relationship between variables does not imply causation).
"키와 몸무게가 상관 있다"는 말은 "키가 몸무게를 만든다"는 뜻이 아닙니다.
2️⃣ 어떤 상관계수를 선택해야 할까?
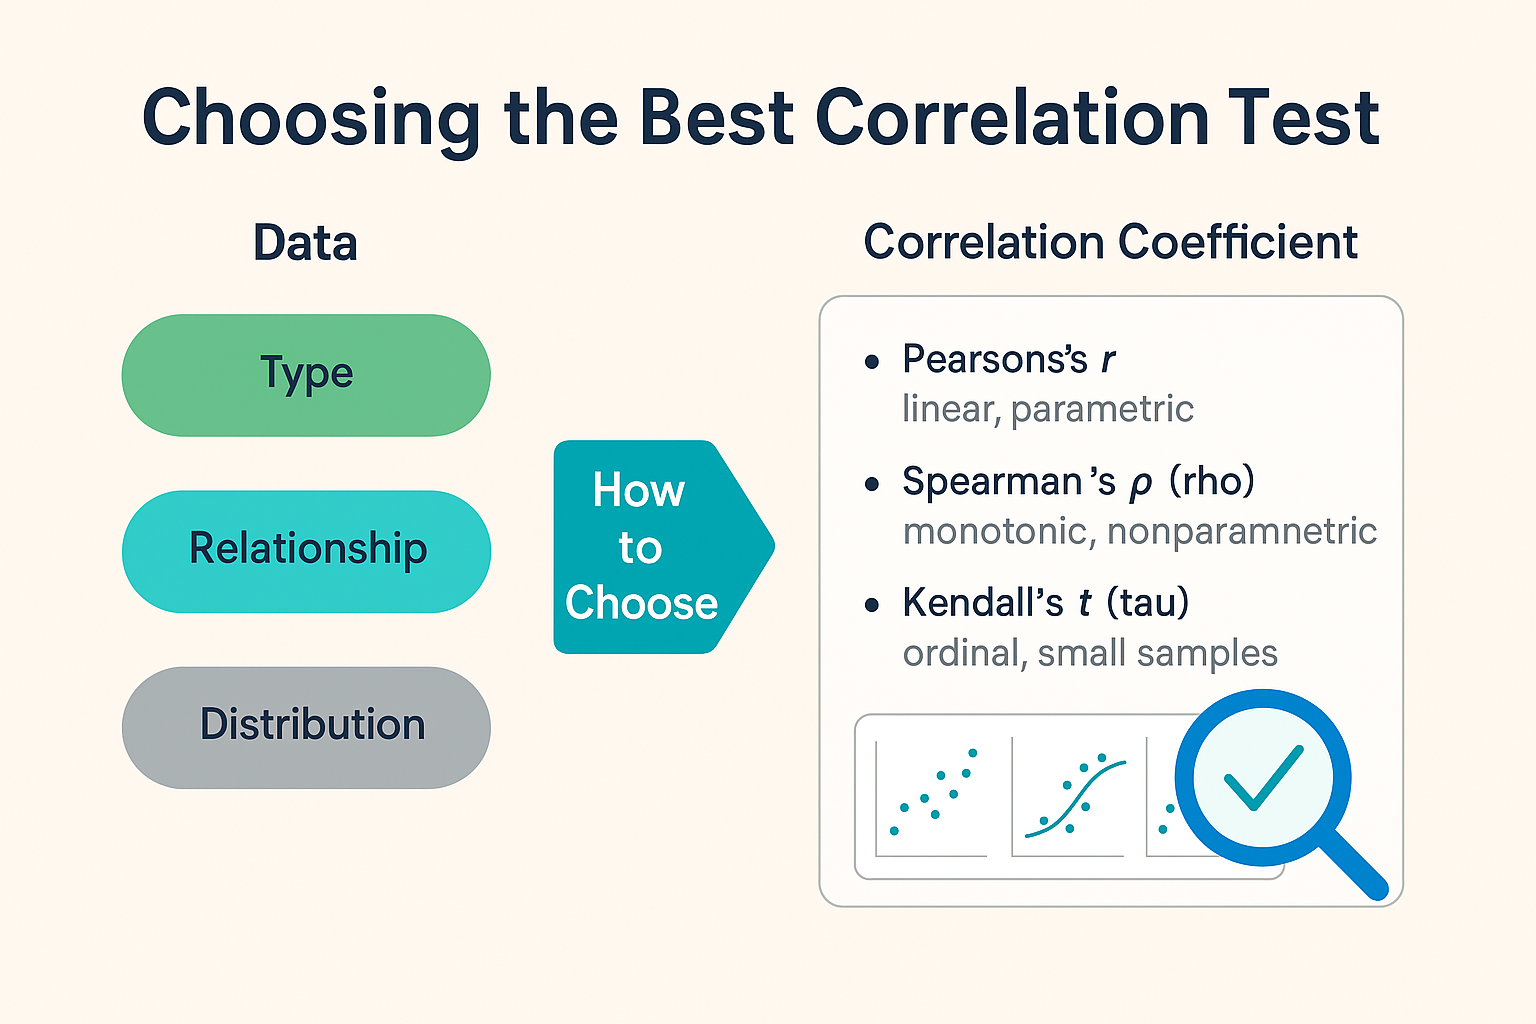
상관계수를 선택할 때는 다음 세 가지를 고려해야 합니다:
- 데이터 유형: 연속형(continuous)? 순서형(ordinal)? 범주형(categorical)?
- 관계 형태: 선형(linear)? 단조(monotonic)? 곡선형?
- 분포 형태: 정규분포(parametric)? 비정규분포(non-parametric)?
* 상관계수 (Correlation Coefficient)
- 상관분석에서 두 변수 간의 선형적 관계의 강도와 방향을 수치적으로 나타내는 통계적 지표로 -1에서 +1 사이의 값을 지님 (a number between -1 and +1 that tells you the strength and direction of a relationship between variables).
- 상관계수의 절대값이 클수록 두 변수 간의 상관 관계가 강하다는 것을 의미하며, 부호는 그 관계의 방향을 의미함 (The closer the absolute value of the coefficient is to 1, the stronger the correlation between the variables, and the sign of the coefficient indicates the direction of the relationship).
🔍 대표 상관계수 종류 비교
📌 1. Pearson's r (피어슨 상관계수) (Pearson product-moment correlation coefficient)
- ✔️ 사용 조건: 연속형 데이터(continuous), 선형 관계(linear), 정규분포(parametric/normal distributions)
- ✔️ 특징: 가장 일반적이며, 강력한 통계적 검정력 보유
- ✔️ 예시:
- 나이와 키 간의 관계
- 기온과 아이스크림 판매량
- 직무 만족도와 연봉

[출처] https://jukebox.esc13.net/interactiveGlossary/HTML_files/linearRelationships.html
📌 2. Spearman’s ρ (rho) (스피어만 상관계수)
- ✔️ 사용 조건: 순위형 or 연속형 데이터(continuous/rank), 단조(monotonic/non-linear) 관계, 비정규분포 (non-parametric)
- ✔️ 특징: 변수들을 **순위(rank)**로 변환하여 분석
- ✔️ 예시:
- 교육 수준(고졸/학사/석사)과 초봉 간의 관계
- 말의 나이와 경주 결과 순위 간 관계
🔗 Non-parametric test → 정규성 가정 불필요

📌 3. Kendall’s τ (tau) (켄달 상관계수)
- ✔️ 사용 조건: 순위형 데이터, 샘플 수가 적을 때
- ✔️ 특징: 스피어만과 순위(rank)를 다룬다는데에서는 유사하지만, 데이터 쌍 사이의 동조/반동조(concordant/discordant) 개수로 계산
- 동조 (Concordant pairs): 두 변수가 같은 방향으로 움직이는 것. 즉, 두 변수의 순위가 서로 일관되게 증가하거나 감소하는 관계 (if both members of one observation are larger than their respective members of the other observations)
- 반동조 (Discordant pairs): 두 변수가 반대 방향으로 움직이는 경우. 즉, 한 변수의 순위가 증가하는 동안 다른 변수의 순위는 감소할 때 (if the two numbers in one observation differ in opposite directions)
- ✔️ 예시:
- 두 심사위원의 영화 순위가 얼마나 일치하는가?
- 작은 표본에서의 순위형 데이터 분석
🔗 작은 샘플에서 Spearman보다 더 안정적
🔢 그 외의 상관계수들
✔ 연속형 vs 범주형
| Point-Biserial r | 연속형 vs 이분형 범주 |
| Biserial Correlation | 연속형 vs 이분형 (비연속 분포 가정) |
| Polyserial Correlation | 연속형 vs 순서형 변수 |
✔ 범주형 vs 범주형
| Phi Coefficient | 2×2 범주형 변수 |
| Cramer’s V | 다수 범주 간의 관계 |
🧭 어떻게 선택할까? (결정 흐름도)
아래는 가장 간단한 판단 기준입니다:
- 데이터가 연속형 & 정규분포
→ Pearson - 데이터가 순서형이거나 정규성 없음
→ Spearman 또는 Kendall - 데이터가 범주형
→ Phi, Cramer’s V, Biserial 등
✅ 예시로 정리
| 키와 몸무게 | Pearson |
| 교육 수준(순서형)과 초봉 | Spearman |
| 두 심사위원의 순위 일치도 | Kendall |
| 시험 점수(연속형)와 합격 여부(0/1) | Point-Biserial |
| 성별과 구매 여부 | Phi Coefficient |
📝 마무리
상관계수는 “그냥 cor.test()” 하나로 해결되는 문제가 아닙니다.
데이터의 특성과 연구 목적에 따라, 꼭 맞는 분석 방법을 선택해야 결과의 신뢰도가 올라갑니다.
정리하자면:
- 📐 선형 + 정규분포 → Pearson
- 📊 단조 관계 or 순위 자료 → Spearman / Kendall
- 🧩 범주형 자료 → Phi / Cramer’s V / Biserial
(상관분석 기본개념은 아래 링크 참고)
2022.07.20 - [Main/통계] - 상관분석 (Correlation Analysis) #1 Correlation Coefficient
상관분석 (Correlation Analysis) #1 Correlation Coefficient
1. Correlation (상관관계) : 한 변수가 다른 변수와 동시에 움직이는 정도를 나타내는 통계적 지수 (a statistical term describing the degree to which two variables move in coordination with one another) - 두 변수 간 직선관
kimtutor.tistory.com
3. How to Choose

[출처] https://www.originlab.com/doc/Origin-Help/Correlation-Coefficient
Selecting the right correlation test depends on the data type and distribution.
Choosing the best correlation coefficient for your data depends on several factors, such as the type, level, and distribution of your variables
'Main > 통계' 카테고리의 다른 글
| 📊 회귀분석 (Regression Analysis) #2 – 회귀분석의 종류 총정리! (0) | 2025.05.08 |
|---|---|
| 분산분석 (ANOVA) #2 가정 및 이유 (0) | 2022.08.19 |
| 분산 분석 (ANOVA) #1 분산분석이란? (0) | 2022.08.17 |
| 📊 회귀분석 (Regression Analysis) #2 – 회귀분석의 종류와 활용 예시 완전 정리! (0) | 2022.08.10 |
| 회귀분석 (Regression Analysis) #1 회귀분석이란? (0) | 2022.08.10 |


