>> Although measures of central tendency are useful ways to summarize large sets of data, they do not tell the whole story. Specifically, not everyone is average.
>> Many people may perform near average, but others demonstrate performance that is far above (or below) average. Put simply, people are different.
>> We need to study diversity (differences that exist from one person to another) and consistency (differences in performance for the same person) within a distribution.
>> We need a method to measure and objectively describe the differences that exist within a dataset - in statistics that measure is called variability.
Variability (변산도)
: 한 집단 전체점수의 변산의 정도
: 자료의 분포가 집중경향치를 중심으로 하여 어느 정도로 밀집 또는 분산되어 있는지를 나타내는 통계치.
> The purpose of quantifying variability is to tell us:
- How spread out the scores are in a distribution (descriptive statistics)
- How well an individual score (or group of scores) represents the entire distribution.
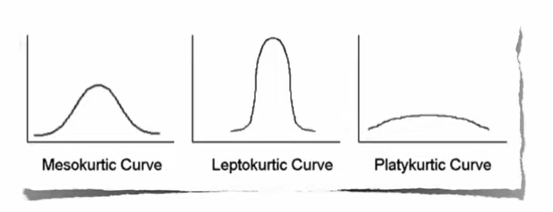
> Zero vs Low vs High Curve
:어떤 분포에서 점수들이 집중경향치를 중심으로 많이 떨어져 있을수록 변산도는 크고, 점수들이 가깝게 모여 있을수록 변산도는 작다고 한다. 따라서 변산도가 커질수록 분포 내의 구성원이 이질적이라는 뜻이며, 이때 평균은 대표치로서의 기능을 상실한다. 반면 변산도가 작을수록 분포 내의 구성원은 동질적임을 뜻한다.
- Zero variability indicates that the scores are all the same.
- Low variability indicates that more scores are close to the center of the distribution; they are less spread out on the measurement scale (leptokurtic)
- High variability indicates that fewer scores are close to the center of the distribution; they are more spread out on the measurement scale (platykurtic)
We will consider three different measures of variability:
- Range
- Interquartile range
- Standard deviation
'Main > Biostatistics' 카테고리의 다른 글
| Biostatistics #3 (Describing Data: Central Tendency 집중경향성) (0) | 2022.03.16 |
|---|---|
| Biostatistics #2-3 (Rank & Percentile, 등수 & 백분위) (0) | 2022.02.08 |
| Biostatistics #2-2 (Shape of Distribution, 분포의 모양) (0) | 2022.02.05 |
| Biostatistics #2-1 (데이터 체계화, Organizing Data - Frequency Distribution) (0) | 2022.02.04 |
| Biostatistics #1-4 (Scales of Measurement) (0) | 2022.02.03 |


