We need a method to summarize each group as a whole so that we can objectively describe how much difference exists between the two groups.
Central Tendency (집중 경향성)
: 모집단이나 표본으로부터 얻어진 자료가 어떤 특정 값을 중심으로 분포를 형성하는 경향 (= 점수값이 어떤 식으로 분포되어 있는지)
: a statistical measure to determine a single value that defines the center of a distribution.
==> The goal of central tendency is to find the single value that is most typical or representative of the entire group.


Unfortunately, there is no single, standard procedure for determining central tendency. No single measure will always produce a central representative value in every situation.
하지만, 어떤 하나의 척도도 모든 상황에서 항상 중심 대표 값을 산출하지는 않는다.
예를 들어,
a) symmetrical, center = 5 ==> it is easy to find the center.
b) asymmetrical, midpoint = 5, but highest frequency = 8, average would be higher than 5.
c) symmetrical, midpoint = 5, but two distinct piles of scores
The solution is three different methods for measuring central tendency: Mean, Median, and Mode.
Measures of Central Tendency
1. Mean (평균, arithmetic mean) : 개체의 모든 점수값을 더한 후, 그 개체의 수로 나눈 값.
: the sum of the values divided by the number of values
- calculated by adding all the data and dividing by their N.
- mean for a population (μ) / mean for a sample (x̄)
- Characteristics of the Mean
- changing the value of any score will change the mean
- adding or removing a score will usually (but not always) change the mean. The exception to this is when the new score added (or the score removed) is exactly equal to the mean.
- adding or subtracting a constant value from each score will add or subtract the same constant from the mean
- multiplying or dividing each of the scores will produce a mean that is multiplied or divided by the same factor.
2. Median (중앙값) : 어떤 집단의 점수값을 적은 것으로부터 큰 것으로 차례로 나열한 후, 그 나열된 점수 중 가운데에 해당하는 값.
: the score that divides a distribution in half so that 50% of the individuals in distribution have scores at or below the median.
- the goal of the median is to determine the midpoint of the distribution
- no special differentiation between sample median and population median.
- appropriate for skewed/open-ended distributions, and distributions with undetermined scores
- Put the scores in ascending order and find the middle value
- If N is odd, the median is the middle score
- If N is even, the median is the mean of the middle two scores

3. Mode (최빈값): 어떤 집단의 점수값 중 가장 많은 빈도의 값
: the score or category that has the greatest frequency.
- appropriate for nominal data
- It is possible to have more than one mode in a given distribution. (Note: it is not possible to have more than one mean or median)
- A distribution with two modes is called bimodal. One with multiple modes is called multimodal.
- If two modes have unequal frequencies, one is called the major mode and the other is called the minor mode.

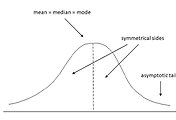
Central Tendency & the Shape of the Distribution
분포의 모양에 따라 평균, 중앙값, 최빈값이 다른 값을 가지기도 한다.


출처: 네이버 지식백과, Youtube > Academic Lesson
'Main > Biostatistics' 카테고리의 다른 글
| Biostatistics #4-1 (Describing Data: Variability) (0) | 2022.03.18 |
|---|---|
| Biostatistics #2-3 (Rank & Percentile, 등수 & 백분위) (0) | 2022.02.08 |
| Biostatistics #2-2 (Shape of Distribution, 분포의 모양) (0) | 2022.02.05 |
| Biostatistics #2-1 (데이터 체계화, Organizing Data - Frequency Distribution) (0) | 2022.02.04 |
| Biostatistics #1-4 (Scales of Measurement) (0) | 2022.02.03 |


